The concept that a fluid cannot maintain a rigid shape is a basic, but important characteristic, which means that fluids cannot sustain a shear- stress (a tangential force applied to the surface). Any tangential force will cause the fluid to deform and continuous deformation is known as “flow”. Fluid flow is always considered to take place within a conductor. A conductor may be the annulus created by casing for drilling fluid or a volcano’s slope and the atmosphere, in the case of a lava flow.
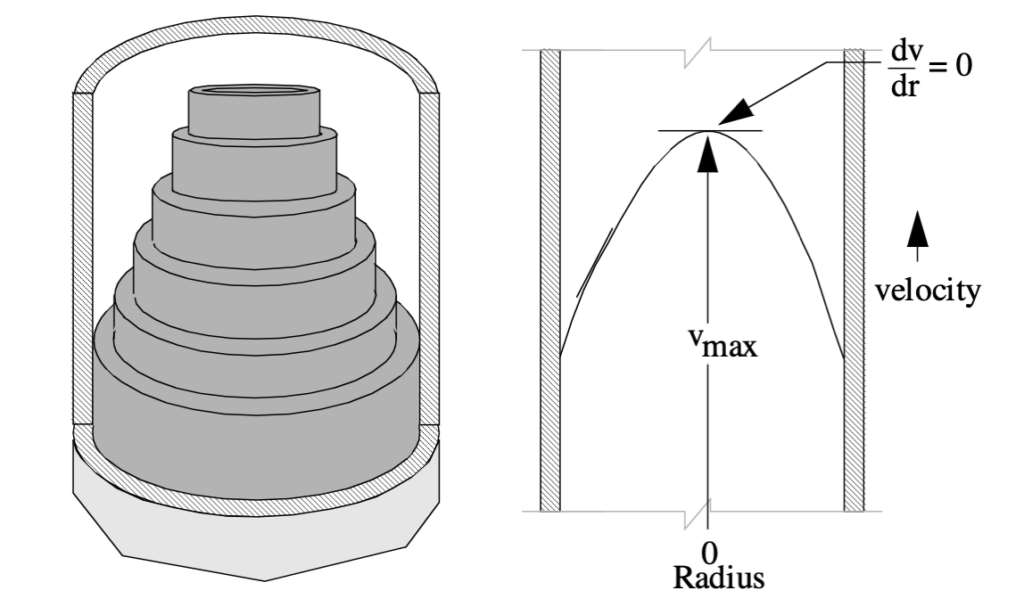
Generally, fluid flow can be considered the result of parallel fluid layers sliding past one another. The layers adjacent to the conductor adhere to the surface and each successive layer slides past its neighbor with increasing velocity. This orderly flow pattern is known as laminar flow. At higher velocities, these layers lose their order and crash randomly into one another with an orderly flow occurring only adjacent to the conductor. This flow pattern is known as turbulent flow. You can calculate Reynold Number at https://www.omnicalculator.com/physics/reynolds-number.
Laminar Flow is usually found in the annulus during drilling operations. This type of flow is generally desired in the annulus since it does not lead to hole erosion and does not produce excessive pressure drops. These pressure drop calculations can be mathematically derived according to the type of flow behavior.
Turbulent Flow is the type of flow regime found inside the drill string during drilling operations. Since high mud velocities are required to achieve turbulent flow, this results in high pressure drops. This type of flow is generally not desired in the annulus due to its tendency to cause excessive hole erosion and high “equivalent circulating densities”. However, turbulent flow can move the mud like a plug, causing the mud to move at approximately the same rate. This provides for better hole cleaning and is sometimes required on high angle holes. Pressure drop calculations for turbulent flow are empirical rather than mathematically derived.
When a force is applied to a static fluid, the layers slide past one another and the frictional drag that occurs between the layers (which offers resistance to flow) is known as “shear-stress”.

Deformation of a Fluid by Simple Shear
The magnitude of shear between the layers is represented by the shear-rate, which is defined as the difference in the velocities between the layers, divided by the distance of separation. It is this relationship between the shear-stress and shear-rate that defines the behavior of the fluid.
For some fluids the relationship is linear (i.e., if the shear-stress is doubled then the shear-rate will also double, or if the circulation rate is doubled then the pressure required to pump the fluid will double). Fluids such as this are known as “Newtonian fluids”. Examples of Newtonian fluids are water, glycerine and diesel. The Newtonian fluid model is defined by the following relationship:
Shear-Stress = Absolute Viscosity x Shear-Rate
The slope of the flow curve in the diagram is given by the absolute
viscosity, this is the shear stress divided by the shear rate. A typical flow
profile for a Newtonian fluid in a cylindrical pipe is a parabola, with a
maximum shear-rate at the wall and a minimum (0) at the center.

Drilling fluids are generally Non-Newtonian in behavior, and are defined by more complex relationships between shear-stress and shear-rate. When fluids contains colloidal particles (or clays), these particles tend to increase the shear-stress or force necessary to maintain a given flow rate. This is due to electrical attraction between particles and to them physically “bumping” into each other. Long particles, randomly oriented in a flow stream, will display high interparticle interference. However, as shear-rate is increased, the particles will tend to develop an orderly orientation and this interaction will decrease.
In the center of a pipe, the shear-rate will be low and hence particle interaction high, giving it a flattened flow profile. This profile has an
improved sweep efficiency and an increased carrying capacity for larger
particles.
As can be seen from the previous examples, the ratio of shear-stress to shear-rate is not constant but will vary with each shear-rate.
Various “oilfield” models have been proposed to describe this non- Newtonian shear-rate/shear-stress curve. In order to arrived at “standard” variables, these models require the measurement of shear-stress at two or more shear-rates to define the curve.
The two most common models used at the wellsite are the Bingham Plastic Model and the Power Law Model.
Bingham Plastic Model
The Bingham model is defined by the relationship;
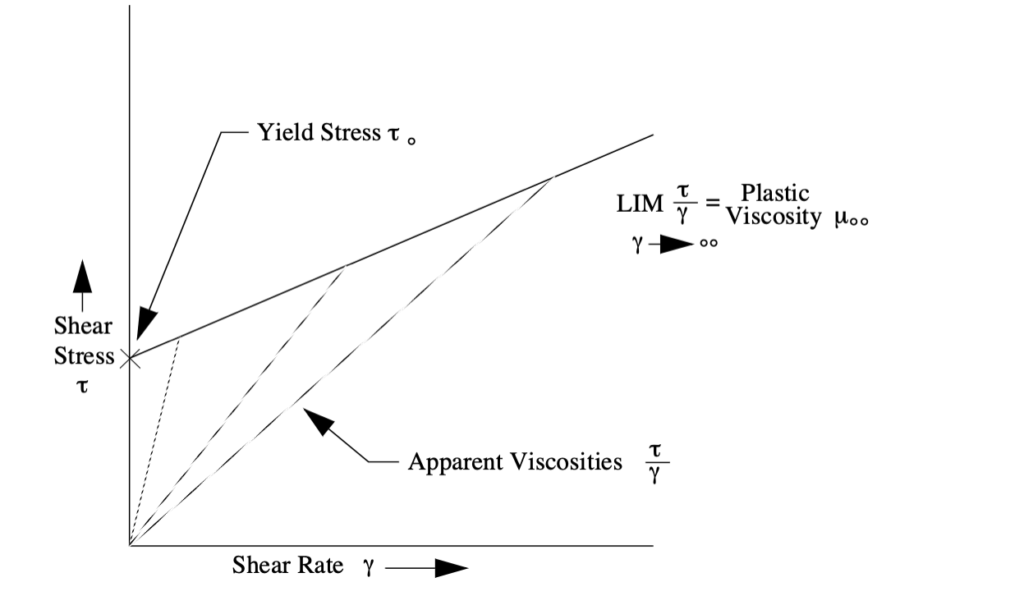
Shear Stress = Yield Stress + (Plastic Viscosity x Shear Rate)
The major difference between this and Newtonian fluids is the presence of a Yield Stress or “Yield Point” (which is a measure of the electronic attractive forces in the fluid under flowing conditions). No bulk movement of the fluid occurs until this yield stress is overcome. Once the yield stress is exceeded, equal increments of shear stress produce equal increments of shear rate.

Flow Curve for a Bingham Plastic Fluid
Note that the apparent viscosity decreases with increased shear rate. This phenomenon is known as “shear thinning”. As shear rates approach infinity, the apparent viscosity reaches a limit known as the Plastic Viscosity. This viscosity is the slope of the Bingham plastic line. The
commonly used Fann V-G meter was specifically designed to measure viscosities for this model. As can be seen in the above illustration, this model does not accurately represent drilling fluids at low shear rates.
Power Law Model
This model is defined by the relationship:
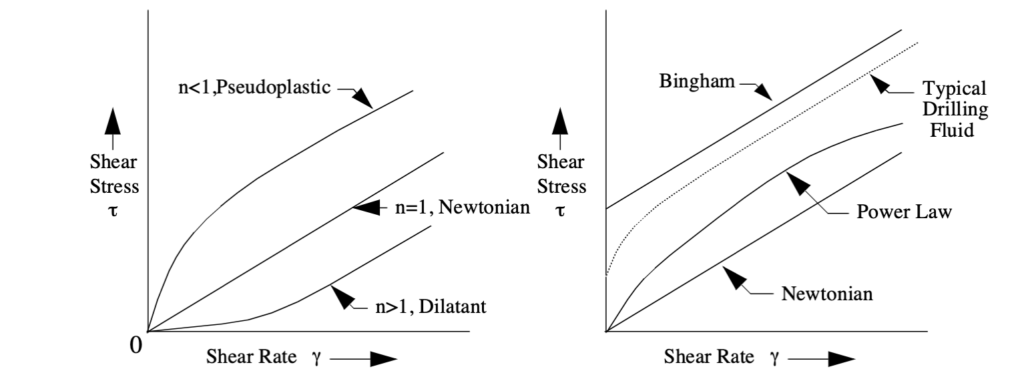
Shear Stress = Consistency Factor x Shear Rate flow behavior index
It describes the thickness or pumpability of the fluid, and is somewhat analogous to the apparent viscosity. The flow behavior index (n) indicates the degree of non-Newtonian characteristics of the fluid. As the fluid becomes more viscous, the consistency factors (k) increases; as a fluid becomes more shear thinning “n” decreases. When “n” is 1 the fluid is Newtonian. If “n” is greater than 1, the fluid is classed as Dilatant (the apparent viscosity increases as the shear rate increases). If “n” is between zero and 1 the fluid is classified as Pseudoplastic, exhibiting shear-thinning; (i.e., the apparent viscosity decreases as the shear rate increases). For drilling fluids, this is a desirable property and most drilling fluids are pseudoplastics.
While the Power Law Model is more accurate then the Bingham Model at low shear rates, it does not include a yield stress. This results in poor results at extremely low shear rates.

A modification to the Power Law Model, the OXY Model, was proposed for use in oil-based muds. The major difference is the viscometer readings used to determine the “k” and “n” values. Power Law uses the 300 and 600 rpm readings, the OXY Model uses the 6 and 100 rpm readings. In addition, other models have been proposed that tend to exhibit behavior between the Bingham and Power Law models at low shear rates.
Non-Newtonian fluids may show a degree of time-dependent behavior. (For example, the apparent viscosity for a fixed shear rate does not remain
constant, but varies to some maximum or minimum with the duration of shear.) If the apparent viscosity decreases with flow time, the fluid is termed “Thixotropic”. Once flow has ceased, a thixotropic fluid will show an increase in apparent viscosity. When apparent viscosity increases with flow time, the fluid is “Rheopectic”.
The shear stress developed in most drilling fluids is dependent upon the duration of shear. A time lag exists between an adjustment of shear rate and the stabilization of shear stress. This is due to the breaking up of clay particles at high shear rates and the aggregation of clay particles when shear rate is decreased, both occurrences take a noticeable length of time.
“Gel strength” is used to measure this time dependent behavior. This gel strength measures the attractive forces of a fluid while under static conditions. If the gel strength increases steadily with time, the gel strength is classed strong or progressive. If it increases slowly with time, it is classed as weak or fragile.

When strong gels occur, excessive pressures may be required to break circulation.
You can learn more about Drilling Fluid at http://oilwellconsultancy.com
Disclaimer: General reading purpose only.